
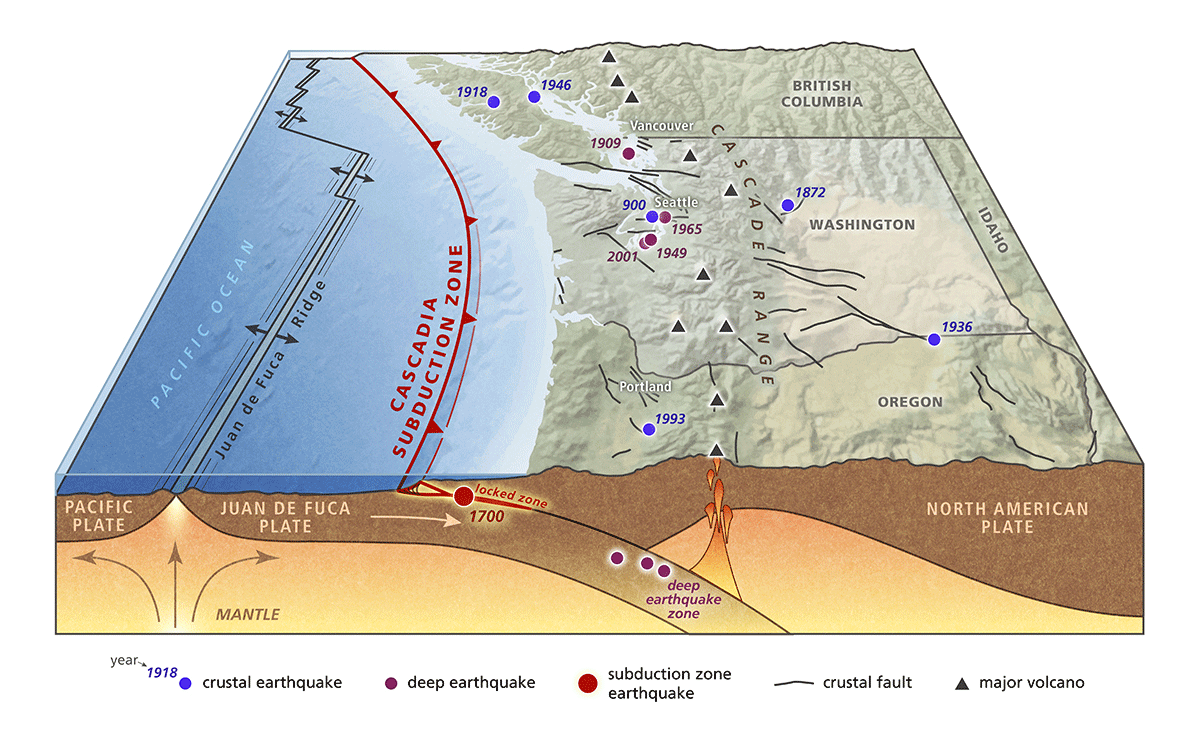
Variations of a Washington-centric Cascadia Subduction Zone diagram made for the Washington Geological Survey.
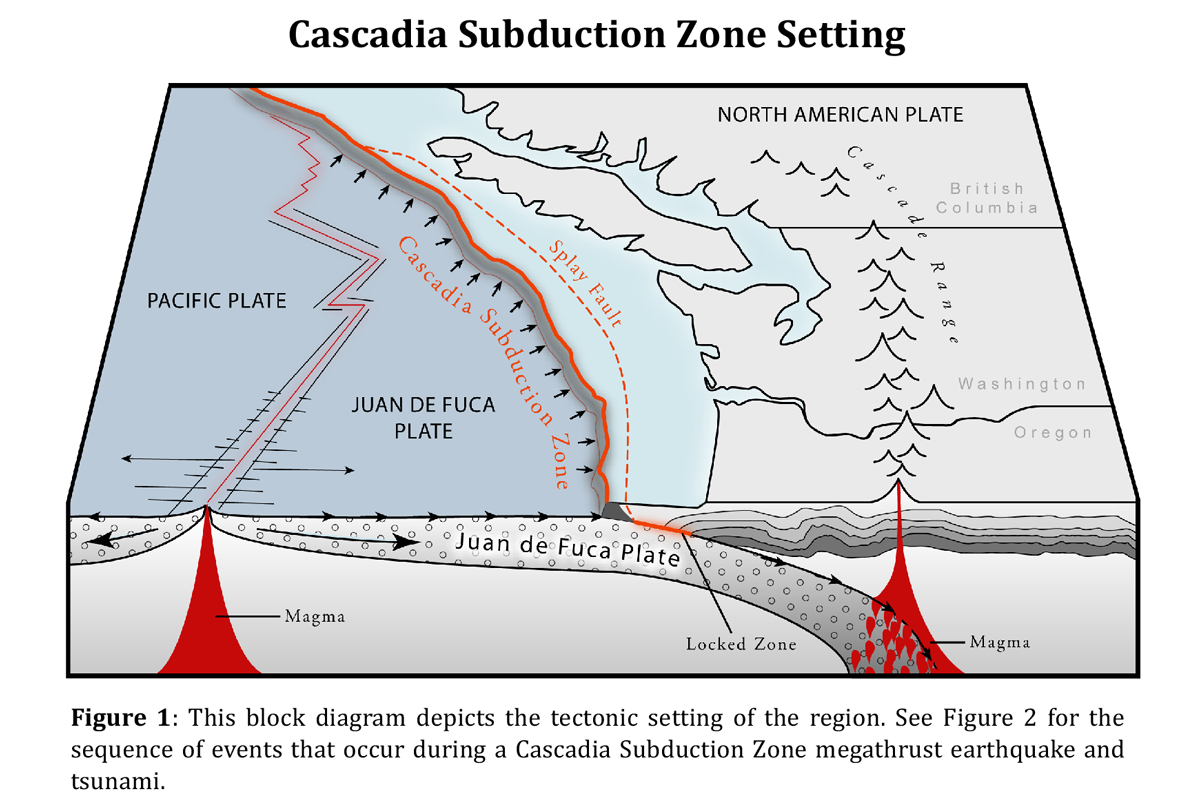
Cascadia Subduction Zone diagram made for the Oregon Department of Geology and Mineral Industries' Tsunami Inundation Map (TIM) series.
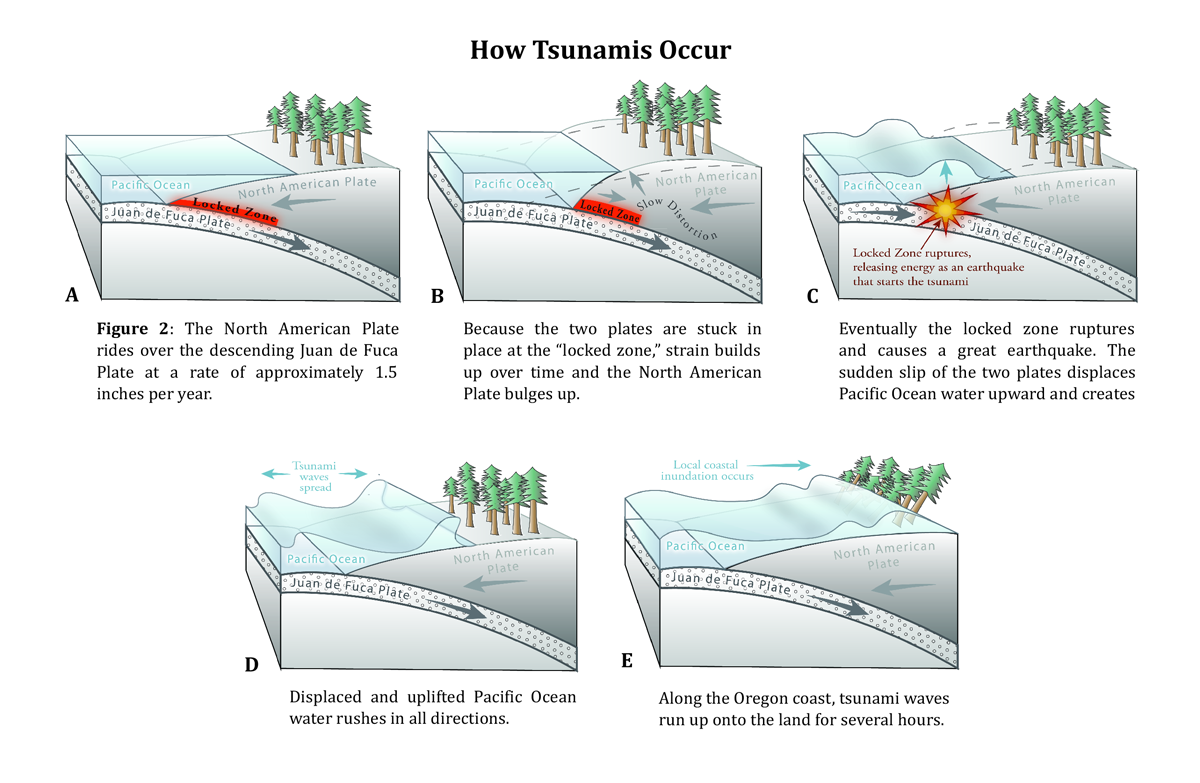
Block diagram depicting a Cascadia Subduction Zone earthquake and tsunami. Made for the Oregon Department of Geology and Mineral Industries' Tsunami Inundation Map (TIM) series.
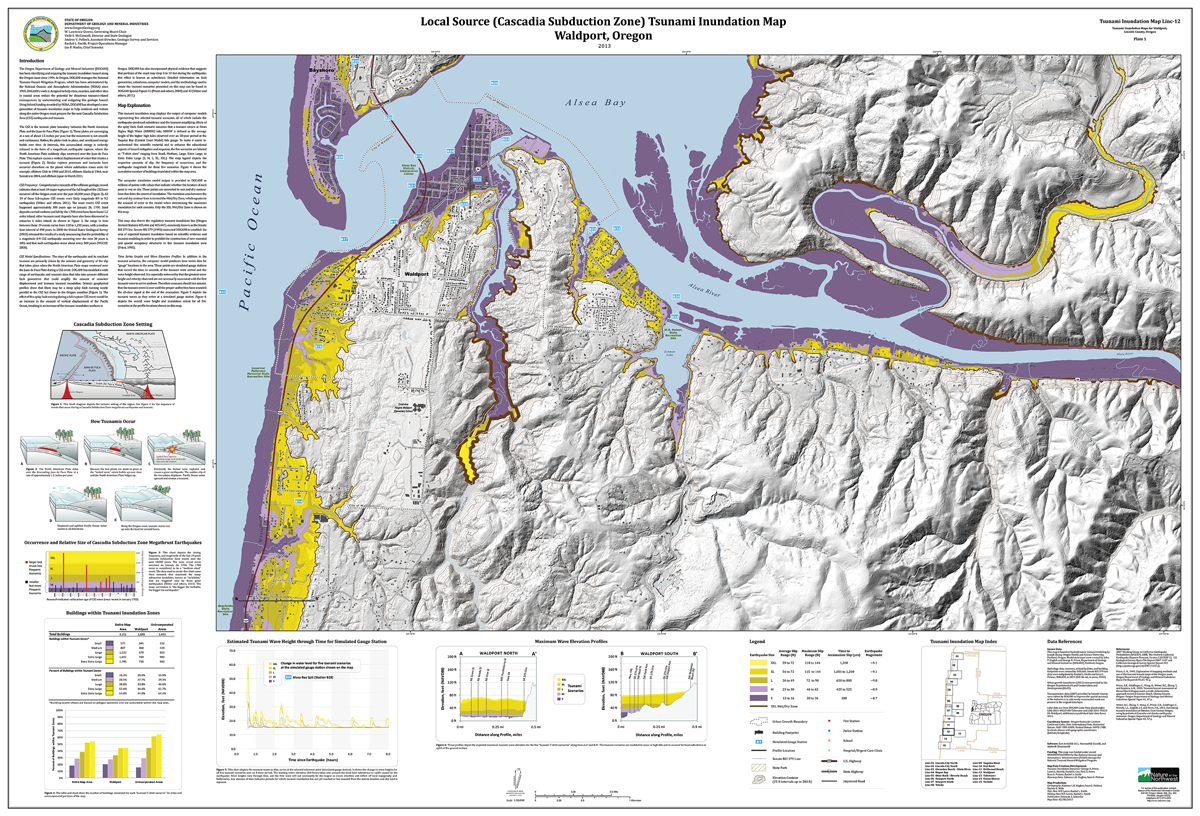
Tsunami Inundation Map of Waldport, Oregon, which includes the block diagrams on the left side.
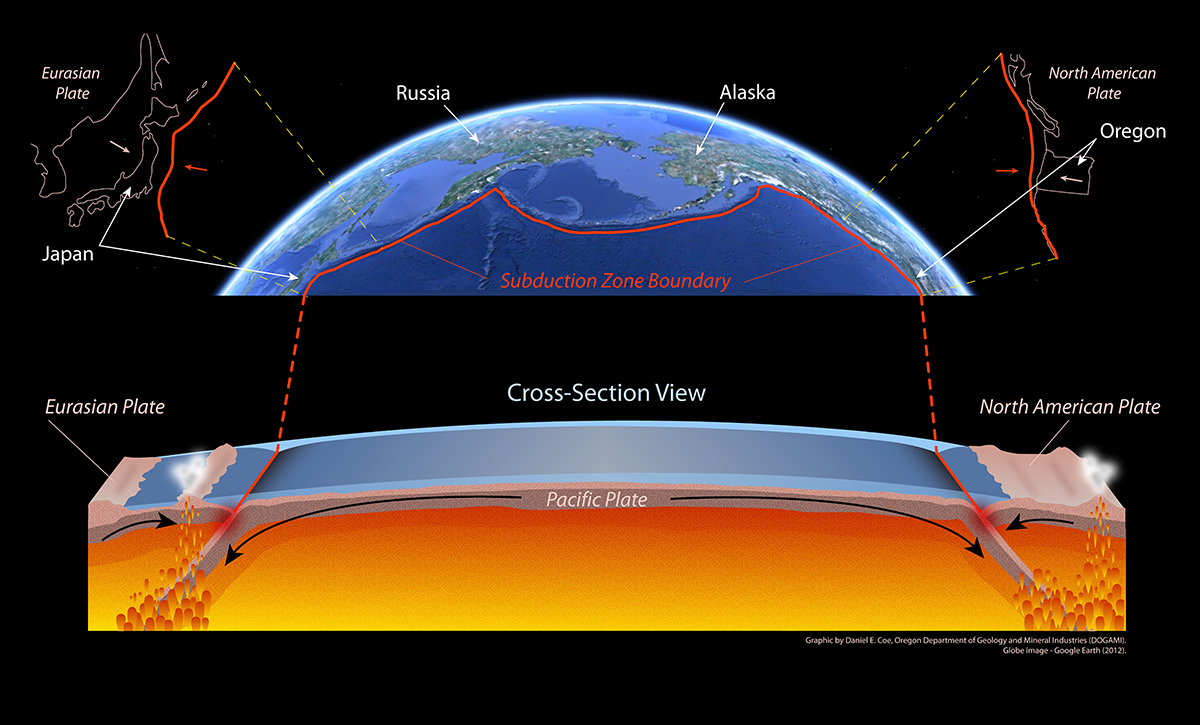
Block diagram comparing the subduction zone conditions in Asia and North America. Made for the Oregon Department of Geology and Mineral Industries.